Within this section, I’ll show you how to answer even more specific questions about your application via the use of custom static probes, and I’ll demonstrate how easy it is to use DTrace within Instruments to extend its already powerful data capture capabilities.
Custom DTrace probes
So far, we’ve only used probes that already exist within the system. DTrace also gives you the ability to insert custom static probes within your own code. These probes can be used to provide even more information to your running DTrace scripts. For example, Core Data uses a set of static probes to track framework-specific events, like database fetches. As I’ll show later, these static probes form the basis for the Core Data instruments within the Instruments application.
These static probes have negligible cost when DTrace is not running, so you can sprinkle them throughout your code without worrying about any overhead. You can think of them as logging statements who only appear when DTrace is running against your application.
To insert your own static probes within a Cocoa application, you’ll first need to create a file that describes your provider and its probes. To walk through this process, I’ll set up another example using the Core Plot project. In this case, I would like to track changes in the position of the Core Animation layers within a graph, to test for cases where the layers are not pixel-aligned and thus will appear blurry.
The provider file I set up for these probes is called CorePlotProbes.d and contains the following:
provider CorePlot {
	probe layer_position_change(char *, int, int, int, int);
};
Here, I’m creating a probe that will pass in a string, the layer’s class name, and 4 integer values, corresponding to the layer’s origin X and Y, and its size and width.
You will need to add this file to your Xcode project, and add an import statement like the following:
#import "CorePlotProbes.h"
Before adding the probes to your code, compile the project once. Xcode automatically generates the header file to support this probe, and that will populate your autocompletion lists with its name.
To use this probe to detect misaligned layers, we’ll add the following to CPLayer, the base class for all of Core Plot’s layers:
- (void)setPosition:(CGPoint)newPosition;
{
	[super setPosition:newPosition];
	if (COREPLOT_LAYER_POSITION_CHANGE_ENABLED())
	{
		CGRect currentFrame = self.frame;
		if (!CGRectEqualToRect(currentFrame, CGRectIntegral(self.frame)))
			COREPLOT_LAYER_POSITION_CHANGE((char *)[[self className] UTF8String],
										   (int)ceil(currentFrame.origin.x * 1000.0),
										   (int)ceil(currentFrame.origin.y * 1000.0),
										   (int)ceil(currentFrame.size.width * 1000.0),
										   (int)ceil(currentFrame.size.height * 1000.0));
	}
}
When compiled, the probe provider file generates a few macros that we use here. The first, COREPLOT_LAYER_POSITION_CHANGE_ENABLED() evaluates to true only if we’re running DTrace and looking for the layer_position_change probe. Otherwise, the following code section is ignored and we incur no performance overhead.
We then perform a check to see if all of the values of the layer’s frame rectangle are integers. If not, something is not pixel-aligned and the probe is triggered.
The probe macro COREPLOT_LAYER_POSITION_CHANGE() takes in the arguments we defined above. Note the conversion of the class name to a C string. Also, because floating point numbers are unsupported in DTrace, we bring in the first three decimal digits of each value by multiplying it by 1000.
The DTrace script to read from this probe is as follows:
#pragma D option quiet

CorePlot$target:::layer_position_change
{
	printf("Misaligned layer: %20s (%u.%03u, %u.%03u, %u.%03u, %u.%03u)\n", copyinstr(arg0), arg1 / 1000, arg1 % 1000, arg2 / 1000, arg2 % 1000, arg3 / 1000, arg3 % 1000, arg4 / 1000, arg4 % 1000 );
}
We use the CorePlot provider, with the application’s process ID, and only need to specify the name of the probe.
The values we passed in as arguments appear as arg0, arg1, etc. The C string value for the class name must be copied into the kernel’s address space using the copyinstr function. The remainder of the arguments are formatted as decimal numbers for printing.
When run, this script produces output like the following:
Misaligned layer:          CPAxisLabel (138.500, 258.334, 22.000, 20.000)
Misaligned layer:          CPAxisLabel (138.500, 204.667, 22.000, 20.000)
Misaligned layer:          CPAxisLabel (243.250, 78.334, 22.000, 20.000)
Misaligned layer:          CPAxisLabel (73.750, 78.334, 22.000, 20.000)
Misaligned layer:          CPAxisLabel (134.000, 63.500, 22.000, 20.000)
Misaligned layer:          CPAxisLabel (134.000, 210.500, 22.000, 20.000)
...
It appears that we have a slight problem with the alignment of the axis label layers, which will lead to blurry-looking text. By adding some more logging functionality to this, we should be able to identify exactly what is causing them to be misaligned.
As you can see, custom static probes can be added in critical areas of your application for debugging or monitoring purposes, and may even be used to provide an NSLog replacement that only activates when you run a simple script against your application. These probes basically disappear when not in use, which is why Apple has added so many of their own throughout the system.
Using DTrace within Instruments
So far, I’ve shown you many ways of using DTrace from the command line, but you can also do almost all of this within Instruments. Custom instruments can be assembled that have the same functionality as a DTrace script, only they are built using a nice point-and-click interface and their results can be observed within the graphical environment of Instruments. Additionally, you can supplement the functionality of your scripts by having Instruments capture a stack trace for every triggered probe, among other things.
I’d like to solve a common iPhone development problem using a custom instrument, that being how to make an application launch as quickly as it can. On the iPhone, when an application launches, a splashscreen called Default.png is pulled up and displayed on screen until the application exits the -applicationDidFinishLaunching: delegate method. The application is unresponsive until this happens, so you want to minimize the amount of processing within that method in order to reduce perceived startup time.
Before I get too far, I’d like to note that neither DTrace scripts nor custom instruments can currently be run against an actual iPhone OS device. This capability may be added in the future, but for now you will need to run your tests on applications running in the iPhone Simulator. Of course, any performance data gathered in this manner will need to be confirmed using other tools that test out your application on the real hardware.
That said, let’s start crafting a custom Instrument to analyze our application. First, start Instruments and begin with a blank document (you could also begin with any of the other built-in instruments, if you’d like). Next, select the Instrument | Build New Instrument menu item.
This will bring up a sheet with a number of sections. These sections correspond to the probe descriptors we set up for our DTrace scripts. You’ll see the standard ones for BEGIN, DATA, and END, and one blank probe descriptor in the middle.
These sheets for the probe descriptors make it easy to build up a probe descriptor, simply by choosing the appropriate options from the pull-down lists. You don’t even need to change the colons into question marks within Objective-C method names.
We’ll set up the first probe descriptor as follows:
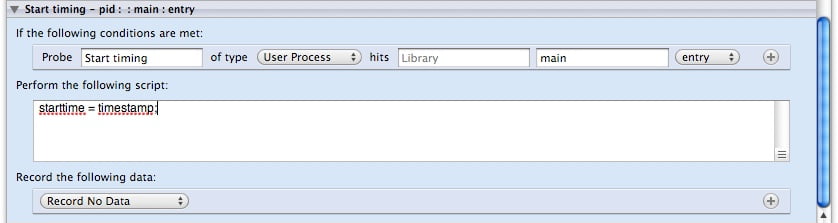
All this will do is start our baseline for timing method executions as the time when the main() function of the application was started.
Next, we’ll need to add another probe descriptor by clicking the plus button in the bottom left of the screen. You may need to scroll down within the list to see the new entry. Let’s set up two more probe descriptors with the following settings:

-applicationDidFinishLaunching: delegate method, which we will use later on to limit our analysis to only those method calls that occur within that scope.The last probe descriptor to set up appears as follows:
In addition to setting up the probe descriptor, we’ve added a predicate by clicking on the plus button to the right of the probe descriptor. This predicate uses the flag we set earlier to only cause the action block to be performed if we are still within the -applicationDidFinishLaunching: delegate method.
We determine the relative time that this event has occurred at within the action block. Instead of using printf, we are going to pass this calculated value to Instruments for logging. We tell Instruments to handle this as an integer, which it is. By clicking on the plus button to the right of this output group, we could have Instruments add output for the class or method name, as well as a number of other variables.
Once done with the configuration of the instrument, we can give it a name and a description, then click Save to add this instrument to our document and save it within our library,
To start our iPhone application and run this instrument against it, first make sure that the application has been compiled and installed in the iPhone Simulator. Then, go to the Launch Executable pulldown and select Launch Executable | Choose Executable.... You can find the executables for the iPhone Simulator within the path [User directory]/Library/Application Support/iPhone Simulator/User/Applications/. The application folders have cryptic numbers assigned to them, so you might need to browse around until you find your application. Once you do, select it.
Click the Record button to start capturing data on your application. Your iPhone application should launch, and Instruments should record a quick flurry of data.
You can see a record of the timestamps of each method call within the startup routines of your application in the table view below the graphs. This provides a nice timeline of what happened when during your application’s initialization, and hopefully it can give you some ideas for how to optimize or defer the processing that’s being performed. For even more information, you can bring up the detail view, which will show a stack trace for each method call you click on in the list.
Unfortunately, I did notice that a slower computer I tried this on (Mac Mini, Core Duo) couldn’t keep up, and seemed to lose a lot of the triggered probes. My MacBook had no problem with this, so your mileage may vary.
If you find that Instruments can’t keep up with the data generated at the start of your application, you can simply export your custom instrument as a script to run on the command line. Select the menu item File | DTrace Script Export... and save the script out to disk. The script will have a section within it describing its use. When you’ve run the script, you can even import the data back into Instruments for later analysis.
These kinds of custom instruments combine the power of DTrace scripts with the ease-of-use and advanced visualization present in modern Mac development tools. They can’t completely replace the scripts for some of the aggregation displays we’ve seen, or for things like in-the-field testing, but many people might prefer them for everything else.
Conclusion
Hopefully, I’ve shown you enough to convince you that DTrace is a powerful framework, capable of providing unique ways to analyze your Cocoa applications. I ignored DTrace for a long while because I believed it was simply too difficult to use for my applications. I was wrong, especially given how easy it is to couple DTrace with Instruments.
If you want to give DTrace a try, pick out some specific problem you’d like to solve (as I did) and assemble a script to help you do that. I think you’ll be surprised at what you learn.
Additional resources
A number of tutorials and pieces of documentation exist for DTrace, starting with guides written for Sun’s Solaris operating system. A few more recent articles described the use of this framework in Leopard. There are far more than I can list here, but among the ones that I found most useful are these guides:
- “DTrace User Guide” by Sun Microsystems: The authoritative reference on DTrace
- “Learning DTrace” by Chip Bennett: An excellent five-part series that explains fundamental DTrace concepts
- “Exploring Leopard with DTrace” by Greg Miller: An introduction to DTrace on Leopard
- “Using Shark and custom DTrace probes to debug Nagios on Mac OS X” by Jonathan Saggau: Another practical example of using DTrace to tune an application
- “Debug Cocoa with DTrace Guide and Embedding DTrace into Xcode Video” by Colin Wheeler: Colin has some very good documentation on using DTrace, including this video walkthrough (he also has a DTrace TextMate bundle to make writing scripts a little easier)
- “Late Night Cocoa Episode 38: DTrace” with Steve Scott and Colin Wheeler: A great podcast episode where Colin walks you through DTrace on the Mac
Leave a Reply