Standard plotting and visualization packages are adequate for most researchers, most of the time, but what if you have to follow a path less travelled, and need diagrams that are not easily generated by existing software? With a little Python, you can relatively easily produce custom graphics by leveraging one of Mac OS X’s great technologies: Quartz.
Quartz has been in Mac OS X since day one, and has played an important role in its success. The eye candy you see whenever you turn on a Mac, from transparent windows to genie effects, is all due to the brilliance of Quartz. And when you generate a PDF file from inside a Mac application, you are also benefitting directly from Quartz.
Apple have supplied Python wrappers for Quartz since the release of Panther. These wrappers make it surprisingly easy to automatically generate diagrams. For example, consider the figure below.
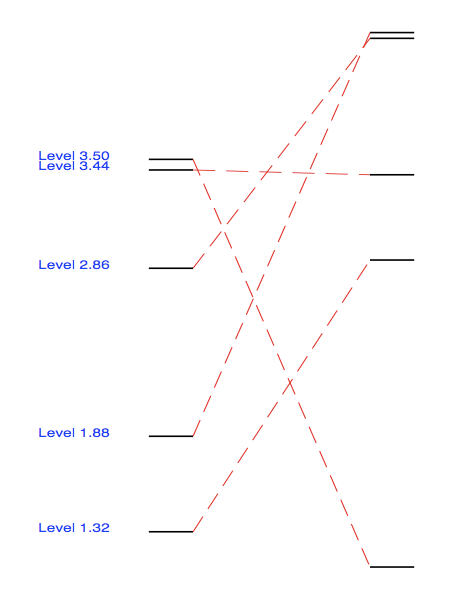
This figure could represent transitions between different states of a system. It is loosely based on a molecular level diagram, but could easily originate from some other field. Only around 70 lines of Python code are required to produce this diagram. Here they are:
#!/usr/bin/python

from CoreGraphics import *
import math, random

# Define the mapping between plot coordinates
# and page coordinates
xPlotRange = 5.0
yPlotRange = 5.0
xPageRange = 792.0
yPageRange = 612.0

# Functions
def drawLevelTransition(c, firstLevel,secondLevel):
    # Draw first level
    c.setLineWidth(.01)
    c.beginPath()
    c.moveToPoint(1.0,firstLevel)
    c.addLineToPoint(1.2,firstLevel)
    c.strokePath()

    # Draw second level
    c.beginPath()
    c.moveToPoint(2.0,secondLevel)
    c.addLineToPoint(2.2,secondLevel)
    c.strokePath()

    # Draw dashed line between levels
    c.saveGState()
    c.setLineWidth(.005)
    c.beginPath()
    c.moveToPoint(1.2,firstLevel)
    c.addLineToPoint(2.0,secondLevel)
    c.setRGBStrokeColor(1.,0.,0.,1.0)
    dashes = CGFloatArray(2)
    dashes[0] = 0.1
    dashes[1] = 0.05
    c.setLineDash(0, dashes, 2)
    c.strokePath()
    c.restoreGState()

    # Write text
    c.saveGState()
    c.setRGBFillColor (0,0,1,1)
    c.selectFont ("Helvetica", 0.07, kCGEncodingMacRoman)
    c.setTextPosition(0.5, firstLevel)
    c.setTextDrawingMode (kCGTextFill)
    text = "Level %3.2f" % (firstLevel)
    c.showText (text, len(text))
    c.restoreGState()


# Create a page to draw in
pageRect = CGRectMake(0, 0, 612, 792)
c = CGPDFContextCreateWithFilename ("energylevels.pdf", pageRect)
c.beginPage(pageRect)

# Apply transform so that we can draw in the plot coordinates
c.scaleCTM(xPageRange/xPlotRange, yPageRange/yPlotRange)

# Draw 5 random transitions for demonstration purposes
for i in range(5):
    first = 5.0 * random.random()
    second = 5.0 * random.random()
    drawLevelTransition(c, first, second)

# Finish off
c.endPage()
c.finish()
To use this script, enter it in a file called EnergyLevels.py, make the file executable, and run it using the command ./EnergyLevels.py. You should end up with a PDF file called energylevels.pdf, containing a figure similar to the one shown above.
The code to generate the figure is fairly easy to read. You should be able to figure out what is going on without any intimate knowledge of Quartz. First, you need to import the CoreGraphics module, which contains the Quartz Python wrappers. Then you need to create a graphics context in which to draw; in this case a PDF context has been used (ie CGPDFContextCreateWithFilename).
Once you have a context you can start drawing. You can apply coordinate transforms (eg scaleCTM), draw lines (eg strokePath), and write text (eg showText), in any color and font you choose. CoreGraphics works as a state machine: when you want to draw a colored line, for example, you first set the color and line width, and then draw the line. You can use the saveGState and restoreGState methods to undo changes you make to the graphics context state. The context keeps track of changes to the state in a Last-In-First-Out (LIFO) manner, so you can embed calls to these methods inside other calls.
This only scratches the surface of what is possible. Other possibilities include:
- Drawing arcs and circles
- Drawing smooth (Bezier) curves
- Drawing transparent shapes and text
- Drawing images
- Apply transformations (translations, scalings, and rotations)
- Generating PDF and bitmap formats like PNG, TIFF and JPEG
- Manipulating PDF files (eg joining)
There are a few places you can learn more about Quartz. The first is Apple’s developer documentation, in particular the Quartz 2D Programming Guide. To learn more about the Python wrappers, there is a short section in the Quartz 2D Programming Guide, and a bit more on your hard drive in the /Developer/Examples/Quartz/Python directory (assuming you have the Xcode Developer Tools installed). The README there has a brief introduction, and the folder is full of Python scripts demonstrating various aspects of CoreGraphics. Lastly, the book Programming with Quartz comes highly recommended.
Leave a Reply